
Workshop traces the journey of UK plastics
The workshop began with a presentation of the data needed to track what types of plastics are in use, where they come from, and where they go (plastic flows). Data is represented in a Sankey diagram. This plots both imports and plastics manufactured in the UK, through to end-use and consumption. Download the full programme here.
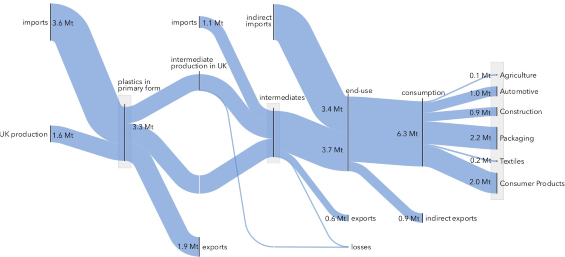
A Sankey diagram is a flow chart where the width of the arrows is proportional to the flow rate. This and other diagrams are explained in the plastic flows report here.
Getting reliable data
Getting reliable data on plastics is not easy. André Cabrera Serrenho used UK trade statistics, which divided up plastics into 464 product categories. Some of these items are fully plastic while others had only a small percentage of plastics. These product categories ranged from rigid tubes, pipes and hoses to artificial guts (sausage skins). Although plastic waste was a category, recycled plastic was not. Tracking post-consumer plastics in the UK is difficult given there are 300 different UK municipal schemes.
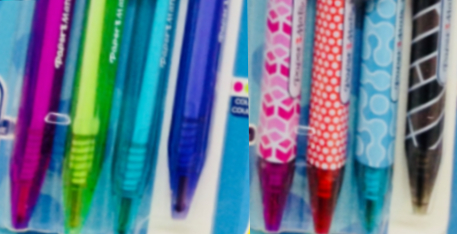
An estimated 75% of a ball-point pen is plastic
UK plastics use
Packaging accounts for most plastic consumption in the UK.
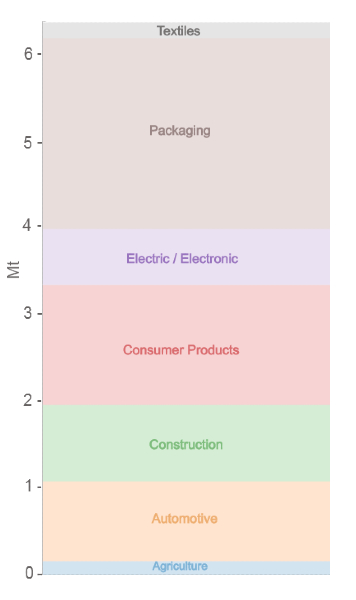 |
6.3 Megatonnes of plastic is consumed each year. This is made up of different types of plastic (PVC/PE-HD/PE-LD/PP), but there is also a large ‘Other’ category that included all other plastics. Part of the challenge was to break down this category into more discrete categories. This includes imported plastic, although getting this information can be difficult. For example, not all importers know what specific type of plastic the toys coming from China are made of. |

Plastic toy jewellery set: Importers are not always sure what type of plastic toys are made from which makes data on plastic less accurate
The efficiency of plastics recycling
A more circular economy often means recycling plastic to make new plastic products. But sometimes, the energy used is more than if the product were made from virgin (non-recycled) plastic. Researchers at The Resource Efficiency Collective look at how materials circulate, but also how energy intensive the cycle from one plastic item to another is. This requires taking into account the quality and quantity of the materials, and how much energy and carbon is used to make them. In terms of the energy efficiency of recycling, as opposed to using virgin materials, efficiency savings were highest with metals and lowest with glass, with plastic somewhere in the middle.

This bench is made from 2000 recycled plastic bottles – The Resource Efficiency Collective look at whether this is the best use of plastic bottles.
The plastic supply chain and data reporting
Peter Levi discussed work on tracking materials. Stuart Foster presented the work of RECOUP, who were involved in the Plastic Packaging Flow Data Report along with Valpak.
Workshop outcomes
The Plastic flows team authored a report from their work and the links to other researchers across the Cambridge Plastics Centre. Download it here. Find out more about the plastic flows team here.


